

- Render(RNDR) price is trading at $1.87 with a decline of -4.11% in the last 24 hours as per CoinMarketCap.
- The current Render(RNDR) ranking on Coingecko is #63 as of 10 July, 2023 with a fully diluted valuation (FDV) of $992,458,090.
- The current Market Cap dominance of RNDR is 0.057% and the current Market Cap is $689,367,815.
The all-time high for RNDR is $8.78 and it is currently trading at a decline of -78.73% from the all-time high.
Render crypto is the term for the digital currency of the Render Network, a distributed platform that uses GPU power for rendering services. The Render Network enables users to share their GPU resources with other users who require them for producing digital content, such as 3D images, motion graphics, visual effects, and more.
Render (RNDR) reached its peak value of $8.78 on Nov 21, 2021 (Over a year ago). The current value is -78.73% below the highest value ever and Render (RNDR) has declined by -8.13% in the past week. There has been an advance of +18.93% in the trading volume of RNDR resulting in $45.39M in the last 24 hours as per CoinMarketCap.
Render (RNDR) has dropped by -8.13% in the past week, doing worse than the global cryptocurrency market which has fallen by -1.60%, and doing worse than other Ethereum Ecosystem cryptocurrencies which have grown by 12.70% as per Coingecko.
Render Technical Analysis
Source: RNDRUSD.COINBASE.1D by TradingView
Market Structure:
RNDR has been making higher highs for a very long time resulting in a bullish crossover and an ascending triangle pattern which has been recently broken down as the market failed to break the higher levels and the market started to decline after making a swing high of $2.9394 and started making new lower lows and later broke down the Ascending triangle pattern.
Render Indicator Analysis
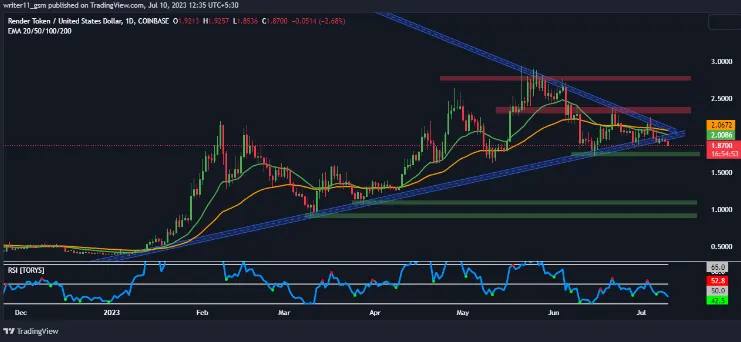
EMA:
Render has recently given a bearish crossover and is slipping below the moving averages resulting in a downtrend. RNDR has also retraced the 20,50-day Exponential moving average after a bearish crossover which represents the reliability of the downtrend.
RSI:
Looking at the RSI we can see that it made double top at the level of 54 resulting in a bearish divergence and is currently trading below the 50 level which represents the dominance of sellers in the market.
Conclusion
By looking at the charts we can clearly see that the market is making lower lows breaking the ascending triangle pattern and giving a bearish crossover of moving average.
The RSI is also trading in negative territory by making a bearish divergence. Hence, by considering the technicals and market structure we can expect new lower prices of Render(RNDR) in the future event.
Technical Levels
- Support Level – 1.7586, 1.1093 and 0.9193
- Resistance Level – 2.3683 and 2.7800
Disclaimer
The information provided in this article, including the views and opinions expressed by the author or any individuals mentioned, is intended for informational purposes only. It is important to note that the article does not provide financial or investment advice. Investing or trading in cryptocurrency assets carries inherent risks and can result in financial loss.