
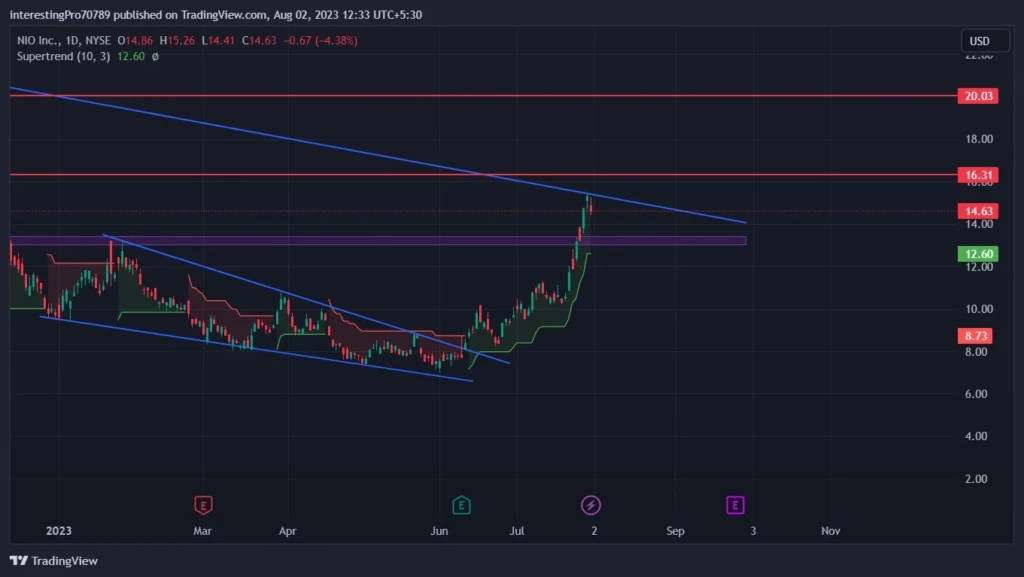
- NIO’s price is currently trading at $14.62.
- NIO’s price has recently given a breakout of the major resistance levels of $13.20.
Will the NIO STOCK Price Increase in the Upcoming Days?
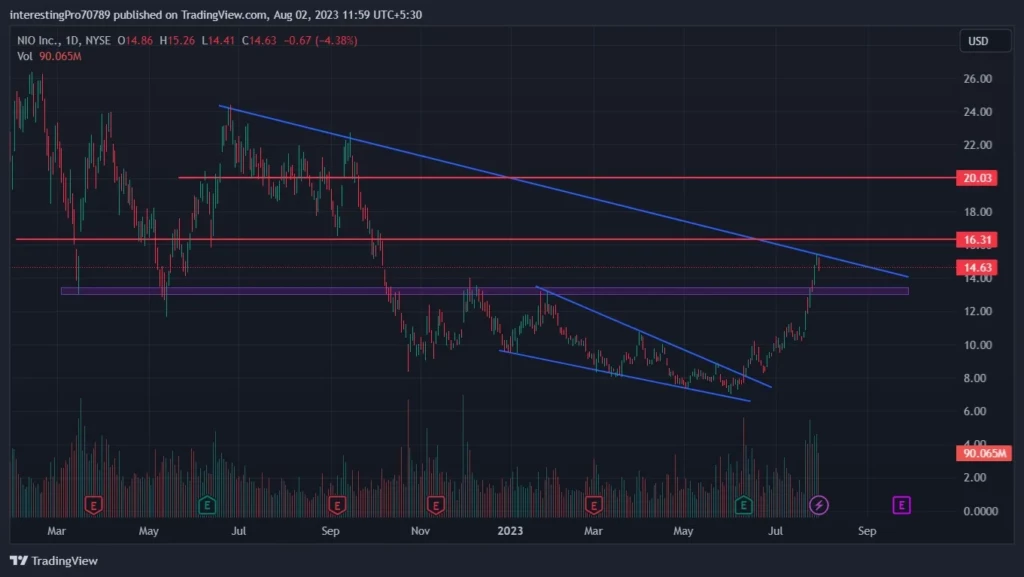
Around January 2023, NIO price was in a downtrend with a lower lows structure and was forming a falling wedge pattern; and around June, NIO price gave a breakout of the falling wedge pattern and rallied to $15.44 from $8.00. During that rally, the NIO price managed to break the major resistance of $13.44. Currently, the NIO price is facing rejection from the trendline. So, it can be treated as a pullback or retest till the $13.44 level. The current NIO price is in a bearish sentiment till $13.44, but if the price manages to sustain over the $13.44 or $13.00 level, one can see the continuation of the bullish trend as the overall NIO chart is in bullish sentiment. In the long term, the NIO price can be seen at $16.31, which is the next resistance, and the first target and the second resistance or second target will be at $20.
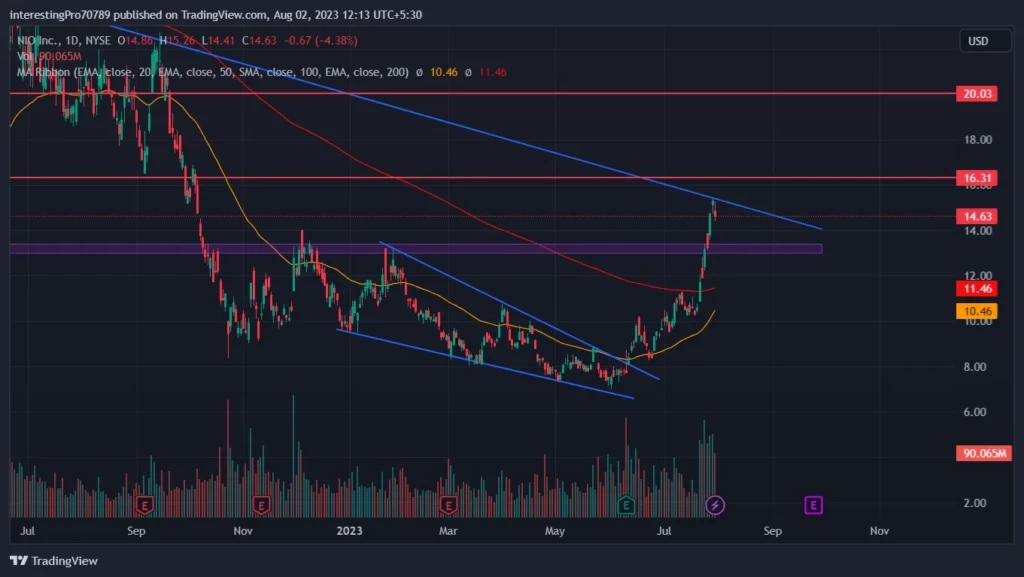
NIO’s price is currently trading above the 50 (yellow line) and the 200 (red line) EMA.
Both the EMAs started facing in an upward direction and are very close to each other.
If we see the EMA lines crossing each other in the future where the 50 EMA crosses the 200 EMA from downside to upside, a very good upside movement is expected. Or if we see the NIO price getting rejected from the EMAs or sustaining above the EMA, then also a good bullish move is expected till $16.31 as the first target and $20 for the second target.
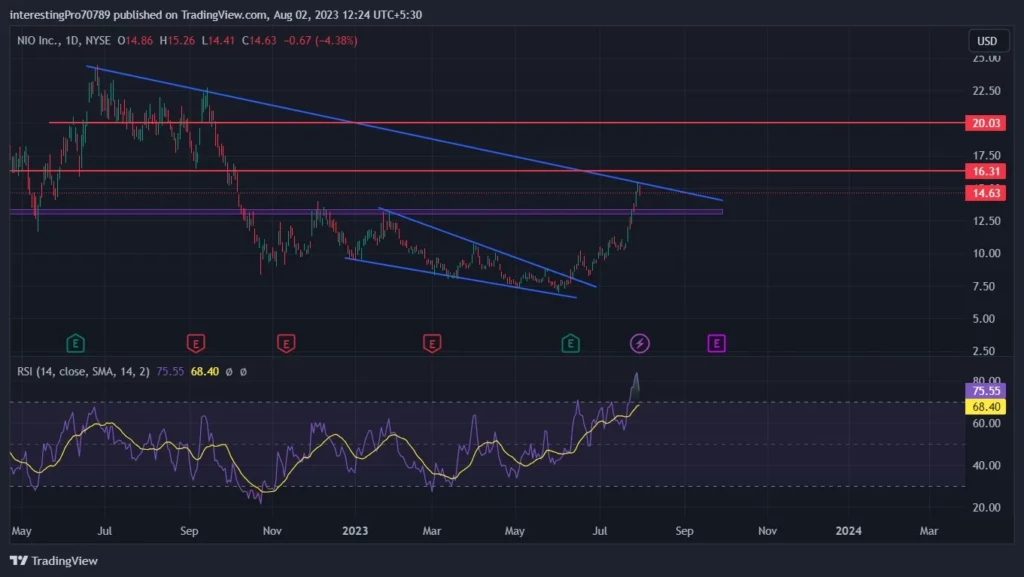
The Relative Strength Index (RSI) is currently showing that the NIO price is in the overbought scenario. As mentioned above, after a big rally in NIO price and the breakout of the resistance level, the price of NIO is getting rejected from the trendline coming from above, which can be seen as a pullback or retest. Once the price gets back to the $13.44 or $13.00 level and the price manages to sustain over these levels, then a good upside move can be planned for the long term till its next resistance at $16.31 which will be the first target and then $20 which will the second target.
The super trend is indicating bullish sentiments in the NIO price because the price trading is very far from the green line. If the price manages to break the green line with a strong bearish candle, then only the NIO price sentiment can be turned into bearish momentum. As for now, price trading above the green line indicates bullish momentum.
Conclusion
The overall technical analysis of the NIO price is bullish. However, the RSI is in the overbought territory, which indicates that the price is still due for a pullback after such a big rally. If we see the price coming down to $13.44 or $13 level and it manages to sustain over these two levels, then a strong upside move is expected to $16.31 and $20.
Technical levels
Resistance levels:$16.31 and $20
Support levels: $13.44 and $13
Disclaimer
The views and opinions stated by the author, or any people named in this article, are for informational purposes only. They do not establish financial, investment, or other advice. Investing in or trading crypto assets comes with a risk of financial loss.