
- Energy Transfer price augury: The revenue of the stock has declined in the last quarter, but the net profit has increased.
- The price is in an uptrend with resistance about to be broken. Will the stock move continue?
- The stock broke its resistance on 11th July 2023 with a strong uptrend.
About Energy Transfer
The Energy Transfer LP, founded in 1995, is a listed company on the New York Stock Exchange of the US which is engaged in the transportation business of natural gas and propane pipeline. Its subsidiaries include Sunoco Logistics Partners LP, LA garage acquisition, and many more.
Latest Quarter Financial Highlights
The quarterly sales decreased in the latest quarter of March by 7.3%
The Cost of Goods sold (COGS) has declined from 84% to 82%, which is balancing the gross profit reduction due to fewer sales numbers.
Due to the decrease in the ‘other expenses, the operating income margin has been increased to 11%, as compared to the last quarter, which was 9.5%.
Energy Transfer Stock Previous Price Action and Forecasting
ET‘s Previous Price Action
At the end of December 2022, the price started gaining volume. The new year seemed to bring some happy days for the ET investors as the stock broke its previous support of $12.5 and went all over, till it hit $13.5.
Energy Transfer Current Price Action and Technicals
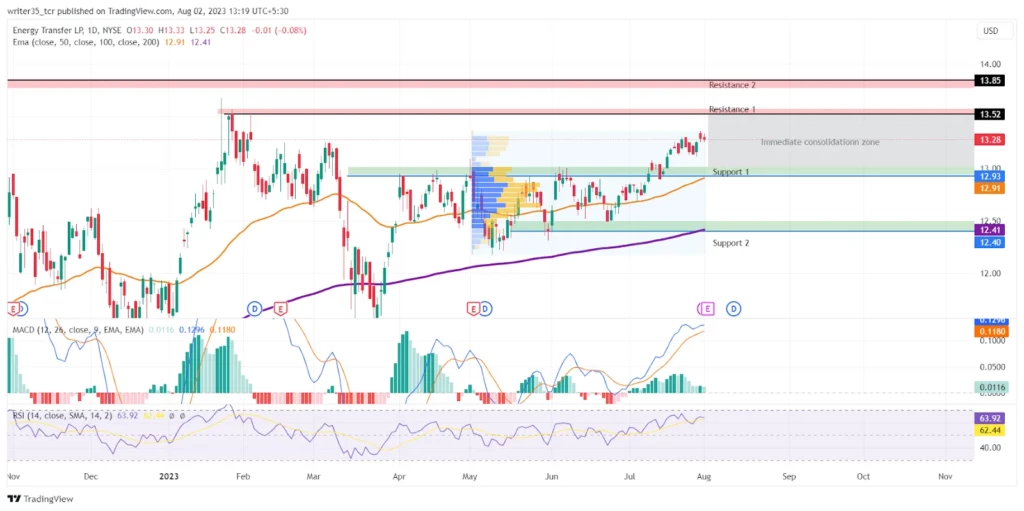
Currently, the stock is seen in an uptrend with a support signal from the indicators. The price is consolidating between $12.9 and $13.5.
Supports and Resistances: There is one support of 12.9 which was made after the price broke its resistance on 11th July. Since it is in an uptrend, this could be firm support, as this is also backed with some volume down the line. The 2nd support is seen at the level of $12.40
Writing for the Resistances, The immediate resistance will be at the level of $13.52. Although not backed by enough volume on this one, another resistance is backed by a confirmation, which was more than 3 years ago in January 2020. This is less likely to break unless a strong bullish momentum is seen.
Indicators
MACD
The signal line crossed the MACD line a week before the official breakout of the resistance that gave support now, indicating an uptrend. Even now, the signal line is below the MACD with a 0.0116 difference.
RSI
The RSI is in the overbought zone of 64 points, which may trigger the bears to start rejecting the trend.
EMA
The 50 EMA is seen in a slight uptrend with a level of $12.91, which is just below support 1. The 200 EMA is at the level of $12.41.
Conclusion
Energy Transfer LP was founded in 1995 and is listed in the NYSE. The company is a transportation business of natural gas and propane pipelines. It has acquired many companies. The latest quarter had sales showing a down opening but it was cushioned by the decrease in the ‘other income expenses’. The price is in an uptrend with some supports and resistances in sight.
Technicals
Support: $12.93, $12.40
Resistance: $13.52, $12.58
RSI: 64
200 EMA: $12.41
50 EMA: $12.91