

- Witan Investment announced a cash dividend of 1.45 with an ex-date of Aug. 24, 2023
- A recommendation is a strong sell.
Witan Investment Trust grew its cash on hand by 5.09%, or 1.76 million, in 2022. Cash Flow from Investing was 151.62 million, which shows that this business made more money from the sale of its current assets than it did from the acquisition of new ones. The debt-to-total capital ratio for Witan Investment Trust is 14.16%, which is higher than the ratio of 9.94% from the prior year.
For the six-month period that concluded on June 30, 2023, Witan Investment Trust plc released earnings figures. The firm generated sales of GBP 135.51 million for the first half of the year, as opposed to negative revenue of GBP 316.52 million the previous year.
Compared to a net loss of GBP 327.29 million the previous year, net income was GBP 123.22 million. In comparison to the basic loss per share from continuing activities of GBP 0.4524 last year, basic earnings per share from continuing operations were GBP 0.1851 this year.
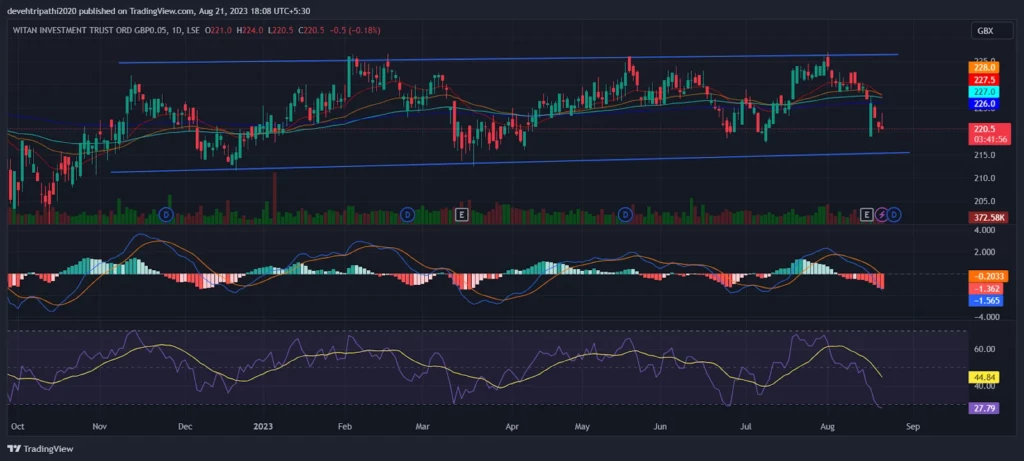
Price Action Sideways Market
The Witan Investment Trust stock price is 220.630 GBX today. Witan’s previous close was 221, and the open was 221.08. The 52-week range is 199.78 to 237.00, while the day’s range is 221.00 to 224.00. The volume is 372,680, and the average volume is 675,595. The market cap is $1.432 billion.
The Momentum Oscillators have 6 properties that are selling, 0 properties that are neutral, and 1 property that is buying. The RSI (14), which has a value of 32.667, indicates that it is in the sell position. STOCH (9, 6) and STOCHRSI (14) both have values of 34.487 and sell positions, respectively.
The CCI (14) has a value of -65.1267, the property is for sale, and the ROC value is -0.510. The property is selling with a 30.615 Ultimate Oscillator.
The Fibonacci Pivot Points are 220.33, 220.43, 220.49, 220.59, 220.69, 220.75, and 220.85.
The Forecast data for WTAN shows a 52-week high of 285.693 a 52-week low of 221.670 and 45-day Moving Average is 228.410 and a 90-day Moving Average of 232.076.
Support And Resistance are good for a trader.
Witan Investment Trust PLC is in a rising trend channel in the medium to long term. This shows that investors over time have bought the stock at higher prices, which indicates good development for the company. A head and shoulders formation is under development. A decisive break of the support at 221, ideally with an increase in volume, signals a further fall. The stock gave a negative signal from the rectangle formation by breaking down through the support at 222. A further fall to 207 or lower is signaled. The stock is between support at pence 220 and resistance at pence 226.
Conclusion
The stock has strong negative momentum, and further decline is indicated. However, particularly in big stocks, a low RSI may be a sign that the stock is oversold and that there is a chance for a reaction upward.
Technical Level
Resistance Level (R3): 225.667
Resistance Level (R2): 224.333
Resistance Level (R1): 222.667
Pivot Point: 221.333
Support Level (S1): 219.667
Support Level (S2): 218.333
Support Level (S3): 216.667
Disclaimer
The views and opinions stated by the author, or any people named in this article, are for informational purposes only. They do not establish financial, investment, or other advice. Investing in or trading crypto assets comes with a risk of financial loss.