

- After a major rally in January and February, OKB has been trading sideways since March. It has given a negative 6% return in the past 3 months.
- It is far less than returns generated by Bitcoin and other currencies in a similar time frame.
- The coin is stuck in a zone between $41.383 and $46.778 and has not breached it even once making it a highly strong zone.
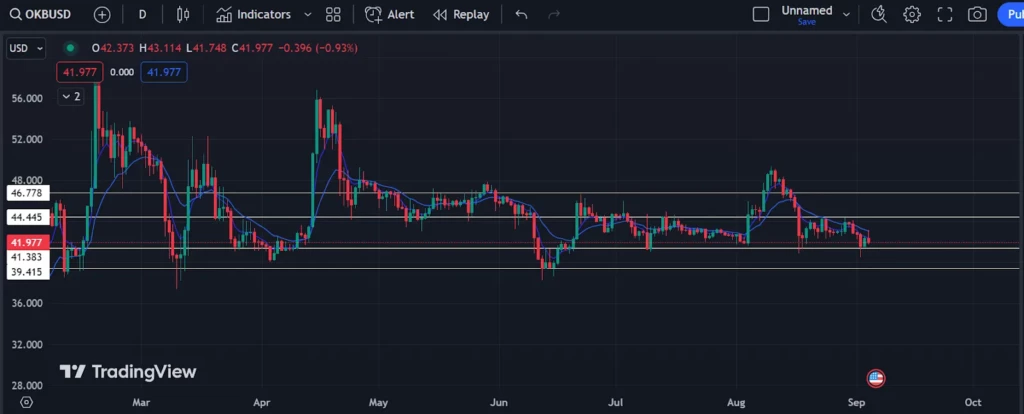
On a daily chart for the currency, we see a strong range bound and sideways movement. It started in May and has been intact since then. The coin was trading with high volumes and volatility till April but has seen a sudden decrease in trading volumes. It resulted in a long drawn sideways movement.
$46.778 has become a highly strong resistance. The coin has faced rejection at that level every single time it has touched it in the past 4 months. On the other hand, $41.383 has been a pillar of support. It has been a strong buying point every time the coin touched these levels.
As of now, the coin trades very near to its support. If the current levels are respected, we can see some recovery going ahead. However, users should avoid long-term entries as long as the coin trades in the current zone.
If we do see a breakdown this time, $39.415 will be our next support. This level has also been highly strong if we look at the coin’s history.
There has been long-term consolidation in the coin. It means both the buying and selling sides are eagerly waiting for a move. Going ahead, whenever the coin tries to breach the current trading zone, we can expect a good move.
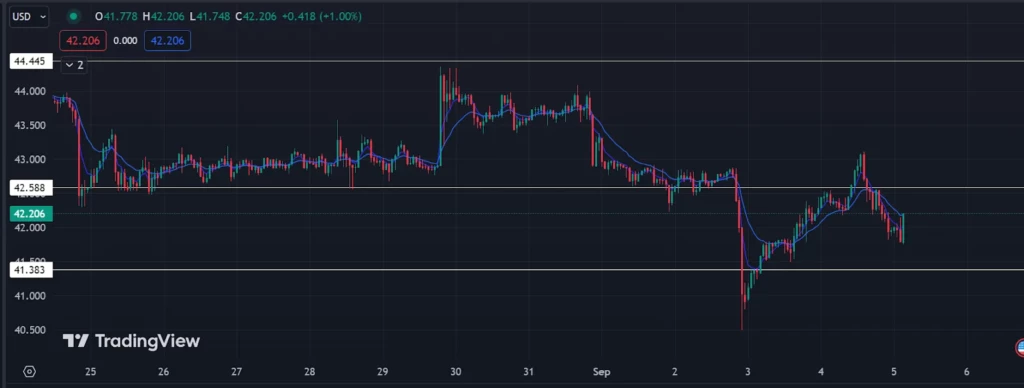
On an hourly chart, we see a strong pullback after a good bearish momentum in the coin. The coin is giving signs of recovery as the last hourly candle made showed strong buying in the coin.
$42.588 currently acts as another resistance level for the coin on an hourly chart. If the coin breaches that level, we can expect a further bullish movement to come into the coin.
For trading, good buying opportunities may occur above the $42.5 level. However, users should make a long-term entry when the stock breaches $44.445 with strong volume.
Many top-performing coins depend on the current market conditions. BTC looks weak as of now and if there is a good fall in the market. We can expect OKB to experience a temporary downfall.
Conclusion
Volumes and volatility have decreased to a great extent in the past few months. OKB has led to a sideways movement. The current setup too does not give signs of a big move on either side. Thus, one must wait for the currency to breach the current trading zone before making a move on either side.
Important technical levels
- Major support levels: 41.383$ followed by 39.310$.
- Major resistance levels: 44.445$ followed by 46.778$.
Disclaimer
The views stated by the author or any person named in this article are purely for educational purposes and do not establish financial or investment advice. Investing or trading in instruments like stocks and crypto involves financial risk and should not be done without doing proper research and analysis.