

- HEDERA PRICE CORRECTED MORE THAN 90% FROM THE HIGHS.
- HEDERA PRICE IS CONSOLIDATING AT LOWER LEVELS SHOWING NO STRENGTH.
- PRICE FALL MORE THAN 9 % IN A WEEK.
Technical Analysis on a One-Day Time Frame
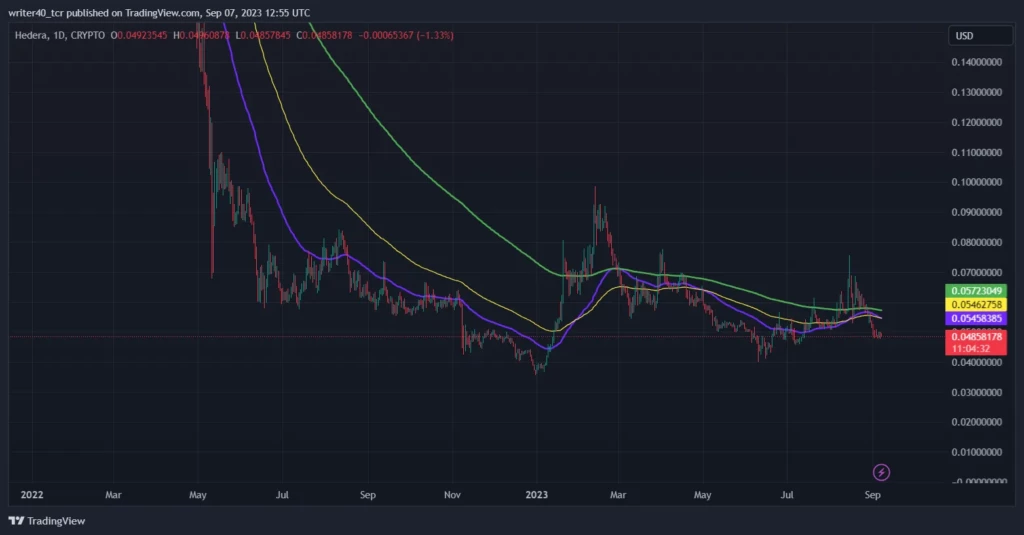
The Hedera token price is trading below all the EMA levels indicating this coin is trading in a bearish trend. Now, the price needs to cross all the EMAs, and then only any upside is possible.
The three major EMAs i.e. 50, 100, and 200 are present at the level $0.048, 0.054, and $0.057 respectively. These will act as a hurdle for this token. As long as the price trades below these levels, it will be difficult for the buyers.
The price fell more than 9% in a week which itself is a red flag for the investors as it can be a sign of a more downfall shortly.
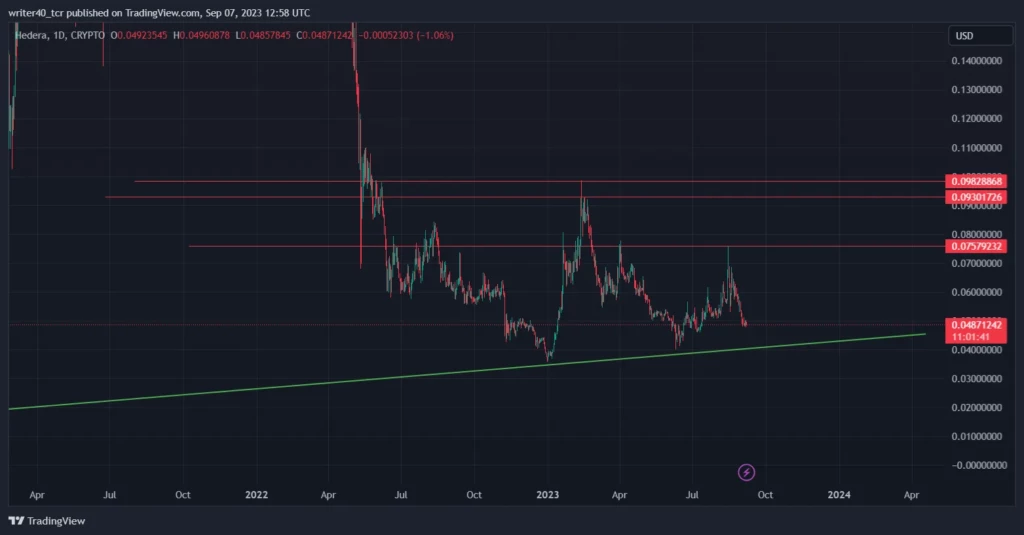
HBAR price took a resistance from its previous swing high so now it created a strong supply zone at that level.
The stock can face resistance near the level $0.093 -$0.098 levels that are mentioned in the chart below. It can support the price near the level of $0.042 and as per the recent moves it is expected that the price will try to test the support levels.
Technical Analysis on a 1-Hour Time Frame
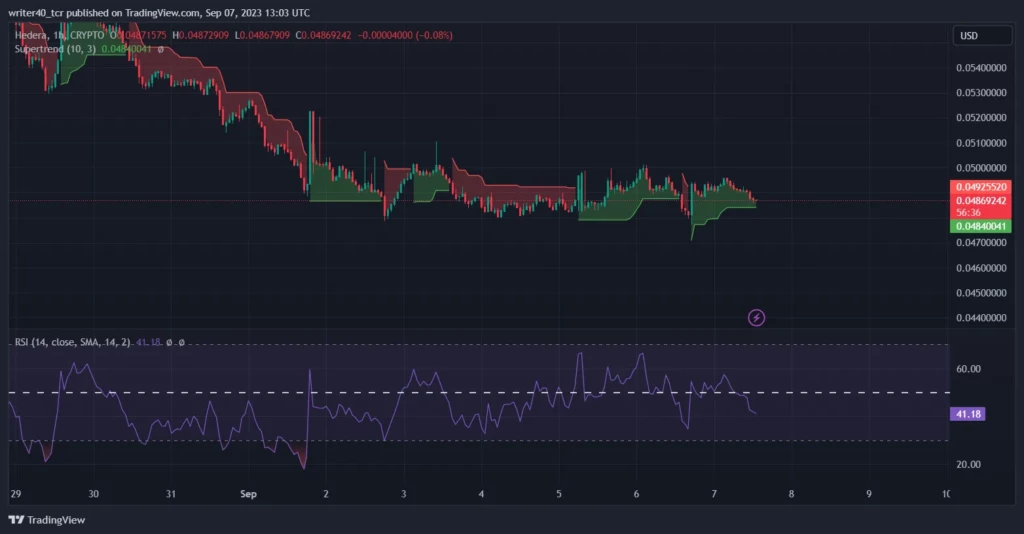
As visible in the chart, the stock is mildly bearish at this level but still holding above the supertrend, which is a bullish sign. Although the price is completely trading in a flat range, in such cases supertrend doesn’t work well. The RSI is below 50, which is a bearish sign. Rsi tried to hold the 50 levels but last week’s fall made it fall below the 50 levels.
Price is almost flat at this level and there is a lack of anticipation in this token which is also not a good sign. If the price continues to trade at this level for more time, more buyers will lose their interest in this token.
Conclusion
The token price has shown a negative reaction over time and currently, both the price action and indicators are giving a bearish sign. So, we can say that the price can try to go down from these levels until and unless the recent resistance levels are near $0.050 is intact. If it breaks the resistance at $0.050, then it can try to rally up to the level of $0.075.
Past Performance
1 WEEK- – ( 9. 36 )%
1 MONTH – – ( 13.56 ) %
1 YEAR – – ( 16. 15) %
Technical Levels
- Resistance – $ 0.051 and $ 0.075
- Support – $ 0. 046 and $ 0. 042
Disclaimer
The views and opinions stated by the author, or any people named in this article, are for informational purposes only and do not establish financial, investment, or other advice. Investing in or trading crypto assets comes with a risk of financial loss.