- Apple stock has declined over 1.87% in a week and 1.20% in a month but surged 13.17% in a year.
- The stock has corrected over 12% from recent highs created in July 2023.
- Apple has shown significant growth in both revenue and net income.
Market capital of Apple Inc – $2.736 Trillion
The current market price of Apple – $175.01
Stock Overview
Apple stock in the previous session on 15 September closed the day in the red as the price fell by $0.73 (0.42%). The stock is in the bearish trend on a shorter time frame as the stock has declined over 1.87% in a week and 1.20% in a month. The stock has surged over 40% from the year’s low which indicates that the overall trend is still bullish.
The revenue of the company has risen from $214 billion in 2016 to $394.33 billion in 2022, a rise of 84.112 % which is huge. Also, the net income of the company has risen from $45.96 billion to $99.80 billion in 2022, a rise of 117% in 6 years which is a significant growth if we consider the size of the company.
The net debt of the company has risen from $19.88 billion in 2016 to $84.18 billion in 2022, a marginal rise of 323% in 6 years. The company’s dividend yield % has been declining over the years which indicates that Apple is not a good dividend-paying stock
Technical Analysis of Apple stock

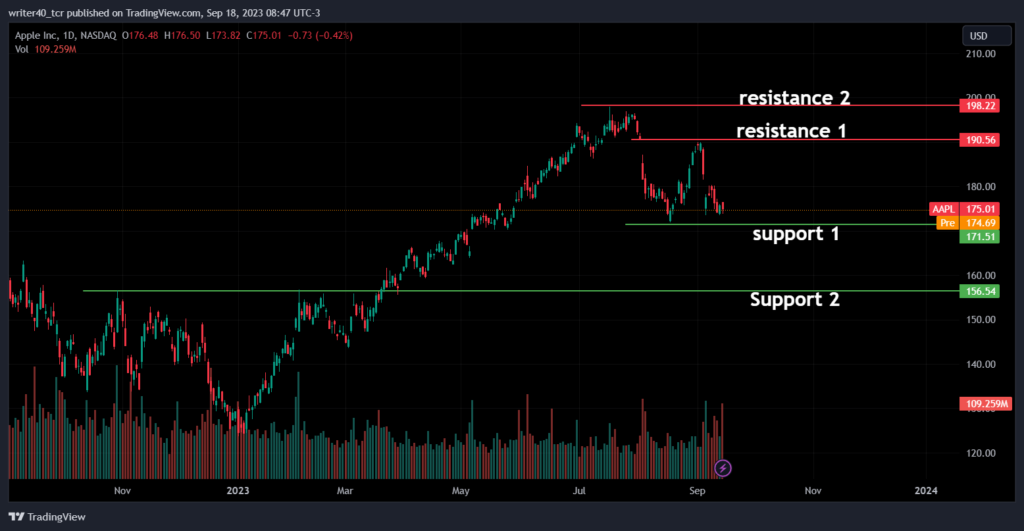
Apple’s price has declined over 12% from highs indicating a short-term downtrend in the stock. The price is currently heading towards its recent support level from where the price bounced back on 18 August. The price has faced a strong rejection from the gap zone created on 04 August and filled the gap and reversed back.
Now the price has formed some important support and resistance levels on the daily chart. The recent support is present near the previous swing low of $172, and the next support area is present near the level of $156.54 which acted as resistance before the stock gave a breakout in March 2023.

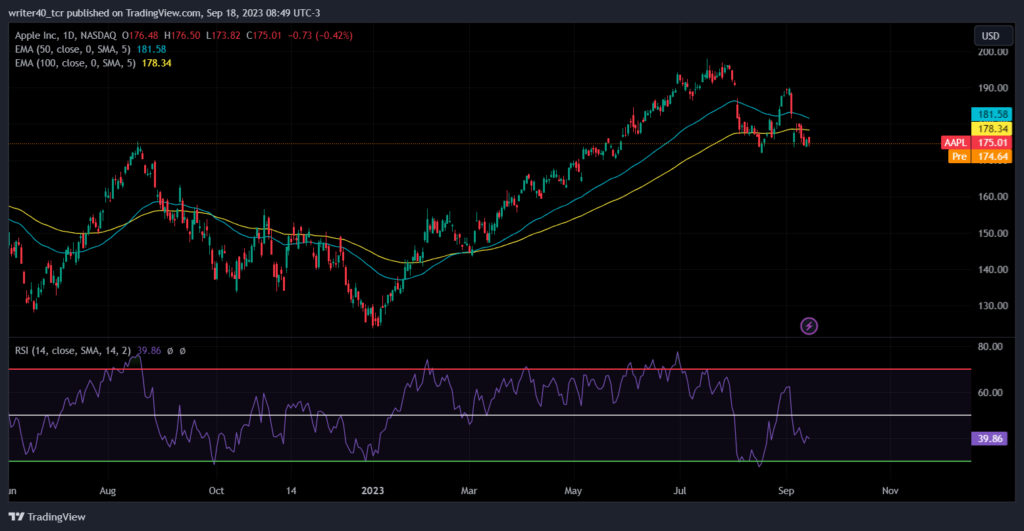
The stock is currently trading below the important EMAs i.e. 50 and 100, which are currently present near the $178.34 and $181.58 levels respectively. Although the stock has not yet witnessed the EMA crossover (a sign of trend change). The Relative Strength Index (RSI) is currently at 39.86 which indicates that the price is losing bullish momentum.
Conclusion
The stock is currently in a short-term downtrend and the indicators are supporting this, which means that the price is facing some selling pressure on the higher levels, although the stock is still up from the lower level and trading near the support. If the price breaches the support level of $72 then we can witness a sell-off which can lead the price towards the $156.54 level.
If the price takes a support near $172 then the resistance that the stock can face is near $190.56 and $198.22.
Technical Level
Resistance – $190.56 and $198.22
Support – $172 and $156.64
Disclaimer
The analysis is done for providing information through technical analysis and no investment suggestions are given in the article to be made by investors. The coins are unpredictable so investors should have proper knowledge. Cryptocurrencies are highly volatile and risky. Investment should be made with proper technical analysis.

