

- CP overall was up by 1752% which indicates that it has given great returns to its investors.
- CP is a class I railroad in N.A.(North America). The stock is listed on New York Stock Exchange(NYSE).
- It is doing its business as CKPC. Let’s interpret the share price of CP.
CP has given great returns in the last 5 years which is around 90%. The stock is performing well overall.
Through technical analysis, we will study the variations in the stock price. It might help to know more about the potential of the stock.
On the line chart, the stock made different patterns on different time frames. Lets see it on the charts.
Technical Analysis of CP(Yearly)
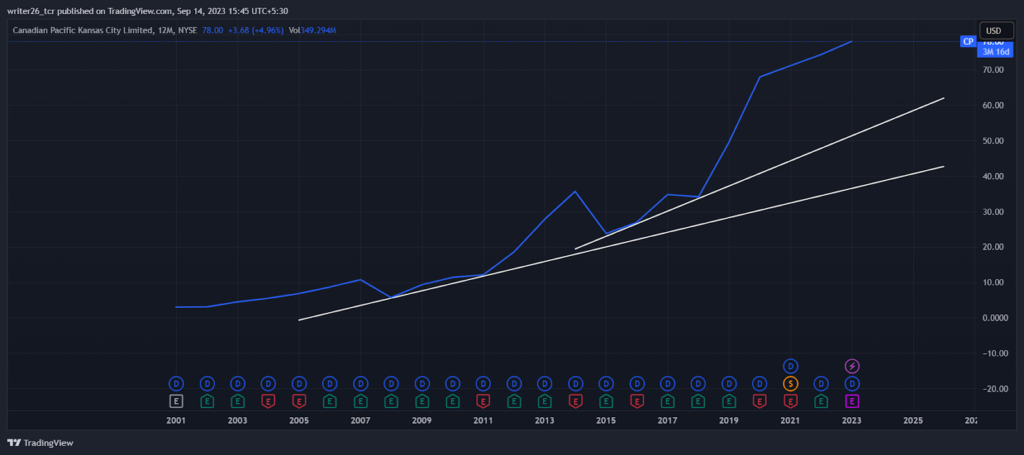
The stock is moving up only since it got listed on the stock exchange. It made new higher highs and higher lows.
Last year, it was up by 1.08%. It might take time to retrace till to make new support on the trend line.
No investment or financial advice is given but investors can use this stock for their portfolios.
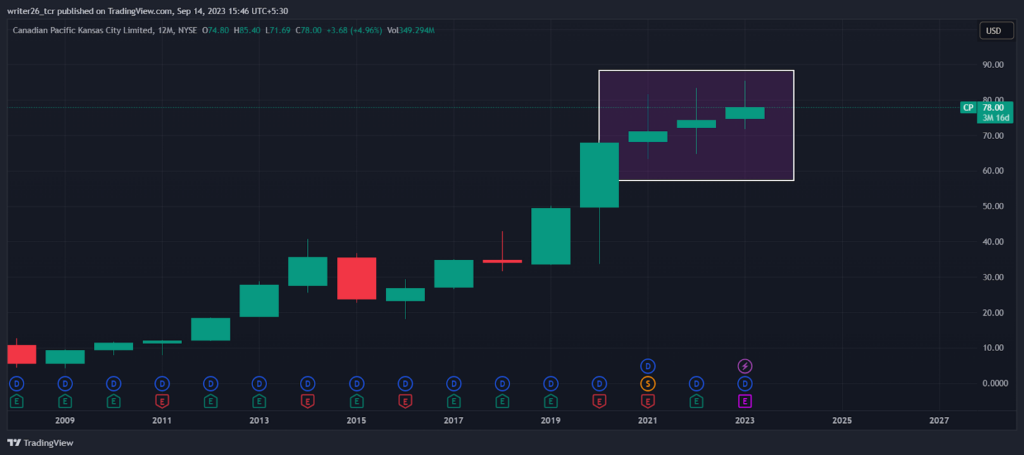
The three white soldiers in the pattern indicates that the stock will continue its uptrend in the future.
The candlestick chart helps us to know more about the stock clearly. These patterns act as confirmations.
Technical Analysis of CP(Monthly)
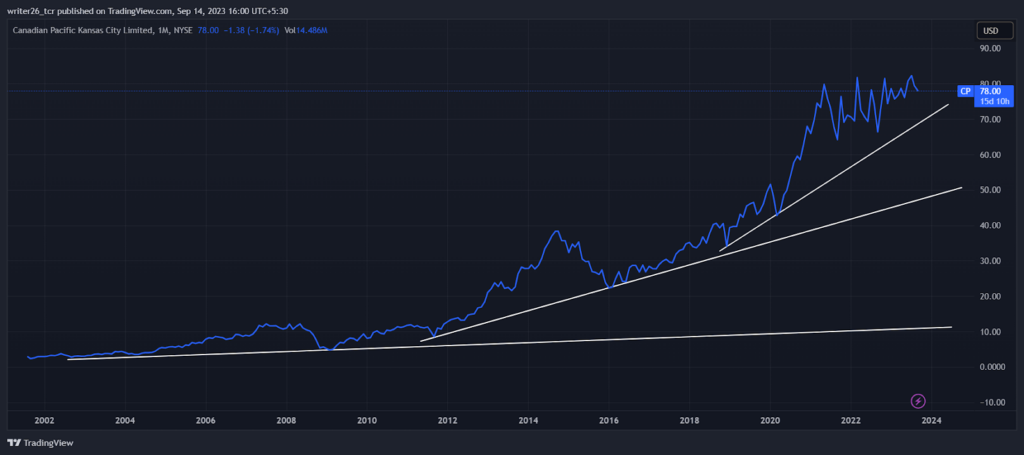
The stock may retrace to $72 price level to take support and might again continue its upward movement.
In the last 6 months, it was up by 6.88% and last month it was down by (2.97%).
Technical Analysis of CP(Weekly)
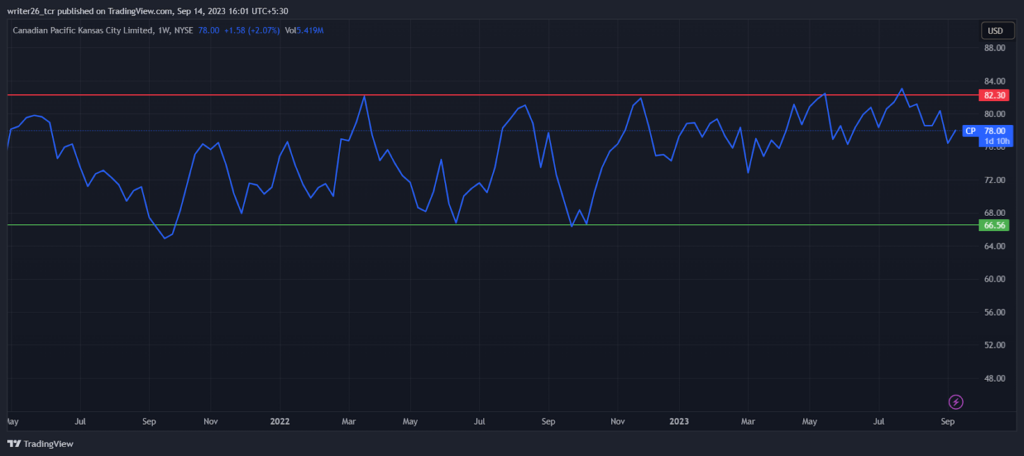
It is in a sideways position and is ranging between a support level and a resistance level.
If it is able to give a breakout then the stock might go in the up direction. It is near the resistance level.
So, the chances of breakout are possible in the up direction.
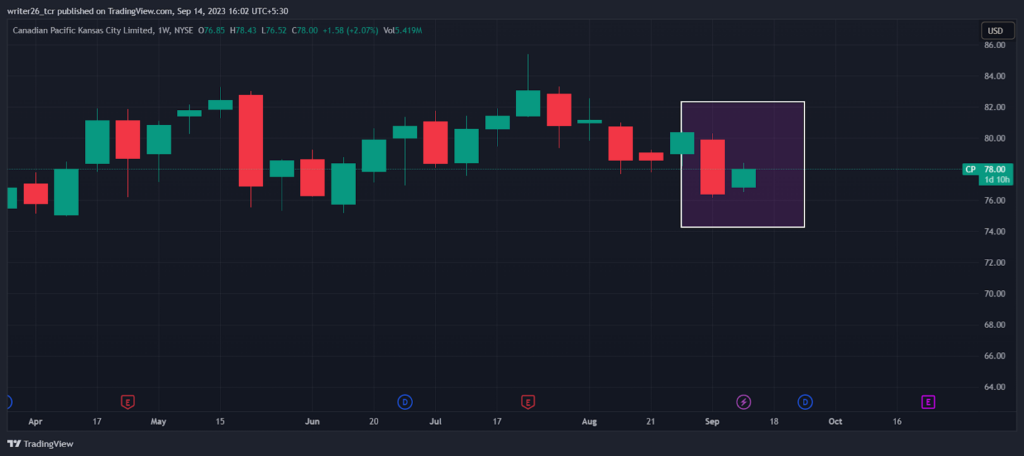
It represents bullish harami which means the bear trend might come to an end. The price may reverse after the formation.
It appears in a bearish momentum or in the middle of a downtrend. In last 5 days it was down by (0.26%).
Technical Analysis of CP(Daily)
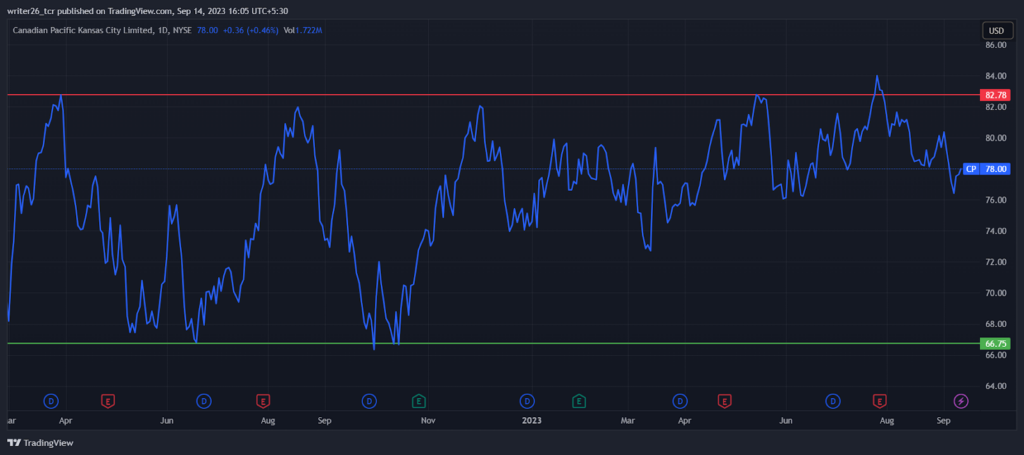
In the daily time frame, the stock price is in a range. The stock is good for long term, medium term investment but not for short term.
In today’s trading session it was up by 0.46%. The stock has been in the correction zone for a long time.
Summary
Through the evaluation of stock with the help of technical analysis we can withdraw that overall the stock is in an uptrend position.
In the monthly time frame, it was in an upward direction which can help to earn good returns.
In the weekly time frame, it is moving in a sideways position.
Also in the daily time frame, it is the same as weekly. Overall it is in uptrend and in monthly and weekly frames it is moving up only.
So the stock does have potential to generate a good amount of returns on the investment made by the general public in the yearly and monthly time frame.
Technical levels
Resistance Level- $82.78
Support Level- $66.75
Disclaimer
The views and opinions stated by the author, or any people named in this article, are for informational purposes only. They do not establish financial, investment, or any other advice. Investing in or trading stocks comes with the risk of financial loss.