

- GRG stock has surged 18.10 % in a year but declined over – 9.92 % in a month.
- The revenue of the company is rising year on year along with the net income.
- The book value of the company is going strong over the period along with the EPS.
Market capital of Greggs Ord Stock – GBP 2.453 B
The current market price of Greggs Ord Stock – GBP 2404
Greggs Ord Stock is currently trading at 2408 and closed flat on its previous close at 0.00% on 12 Sept 2023, the stock went up to the level of 2490 but made a hanging man candle on a daily time frame which indicates that there are strong resistance points in GBP 2500.
Gregg Ord stock’s revenue is increasing on a very positive note and is expected to grow on the same note ahead, if we talk about profit it has also increased significantly over the years which results in the overall rise of the stock as the price has surged more than 180% since 2018 which is considered as a competitive ROI.
GRG stocks EPS has increased from – ( 0.13 ) to (1.16 ) an increase of more than 900% in a single quarter which reflects on the stock price as the price has surged by over 200% between the period of October 2020 to January 2022, the other factor which supported this rally was coroner rally which happened after the mid of 2020.
The net debt on the company is unstable as it has been growing and declining significantly over the years which is one of the concerns of the investors for the longer horizon investment, that’s why even after a great surge in stock the stock started to consolidate at higher levels forming great swings on both sides.
Technical analysis of GRG stock
The stock is falling from a resistance and making a symmetrical triangle pattern probably, which means both the buyers and sellers are trying to dominate each other but both are equally strong in these levels, or they are waiting for a result to come and then they will decide the direction of the stock.
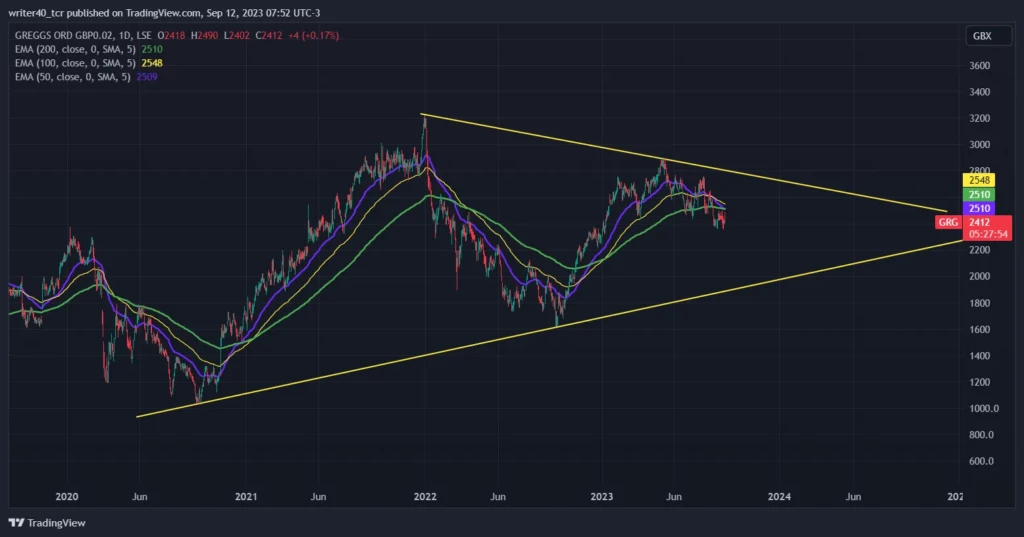
GRG is forming a symmetrical triangle pattern where the resistance is placed near the level of GBP 2750 and the support resistance is standing near the levels of GBP 1845, both these levels will play a very crucial part in stock movement as it is made on a very large time horizon.
The price is trading below the EMAs levels i.e. 50, 100, and 200 which are currently present at GBP 2510, 2548, and 2510 respectively on the daily chart, which can provide some rejection to the buyers invested in this stock. The curve of the EMAs is sloping downward now which means the price is making a bearish trend.
Conclusion
The stock has been consolidating for so long because of which there is some confusion in the mind of investors that the stock will give some return or it will melt down the gains it gave till now.
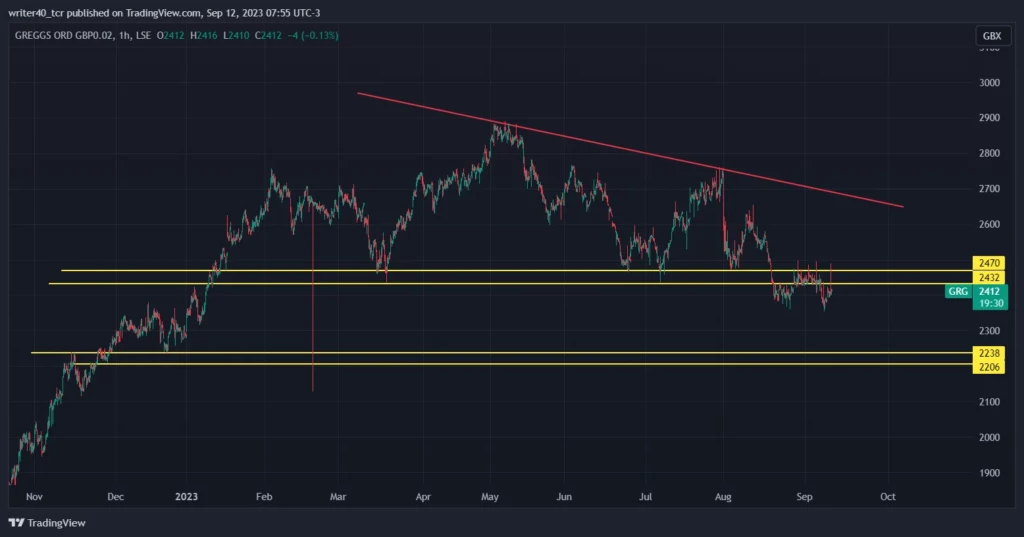
The stock in a shorter time period is trying to breach the bottom levels of the price made from Dec and if the sellers are able to breach the levels this can trigger panic selling in the market.
Technical levels
- Resistance – GBP 2700
- Support – GBP 2432 and 2470
- GBP 2238 and 2206