
- The ICX token price can fall to $0.14 in 2023.
- It is currently trading at $0.164 with a decline of 1.2% in the last 24 hours.
- The token is down by 98.68% from its all-time high.
ICON (ICX) is a layer-one blockchain network that aims at creating a multi-chain bridging solution. It will be extensible, chain-agnostic, and security-oriented. ICON is a hub that connects partner blockchains with all other blockchains, joined through BTP (Blockchain Transmission Protocol).
The ICX token marked its all-time high on 9 Jan 2018, when it was priced at $12.64. This token is currently trading with a volume rise of 7% in the last 24 hours.
- The total supply of the token is currently circulating in the market.
- The total market capitalization of the token is $159.9 Million.
- The 24-hour trading volume of the token is 7.18%.
After it announced the xCall Public Incentivized Testnet Program, the price broke the $0.21 support which is now acting as resistance.
ICX Token Sentiment Analysis
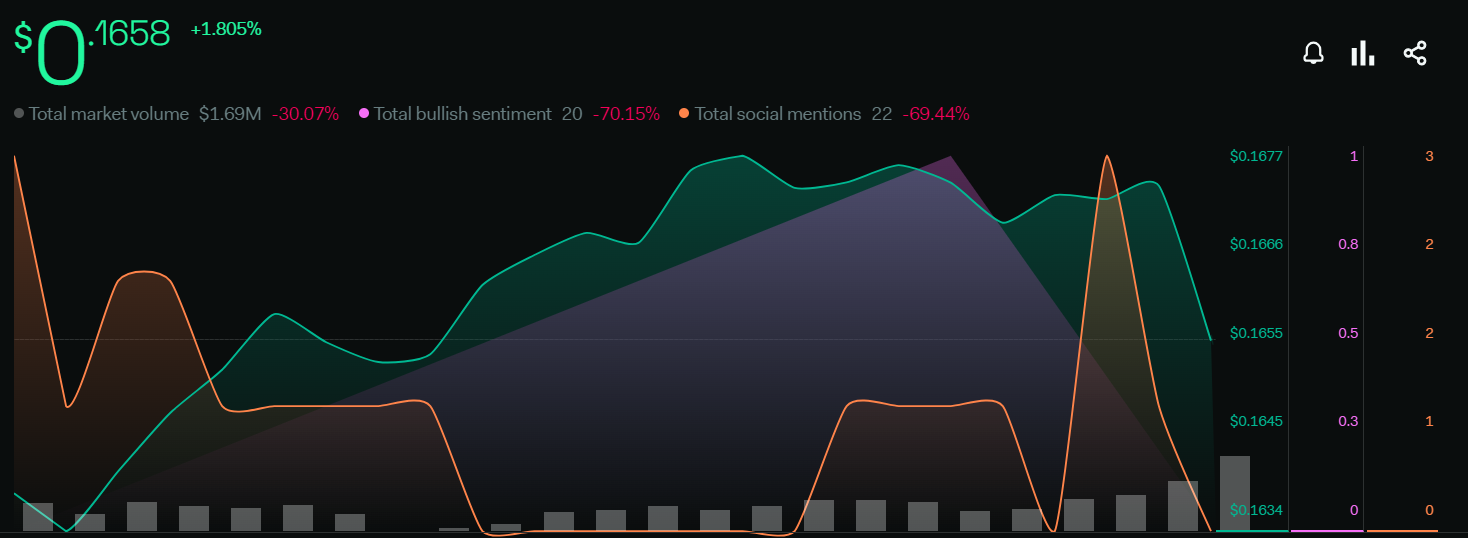
The total market volume declined by 30.07%. The total bullish sentiments decreased by 70.15%. This cryptocurrency’s total social mentions are also on the negative side with a decrease of 69.44%. The overall sentiments are indicating a bearish move in the price.
Daily Technical Analysis
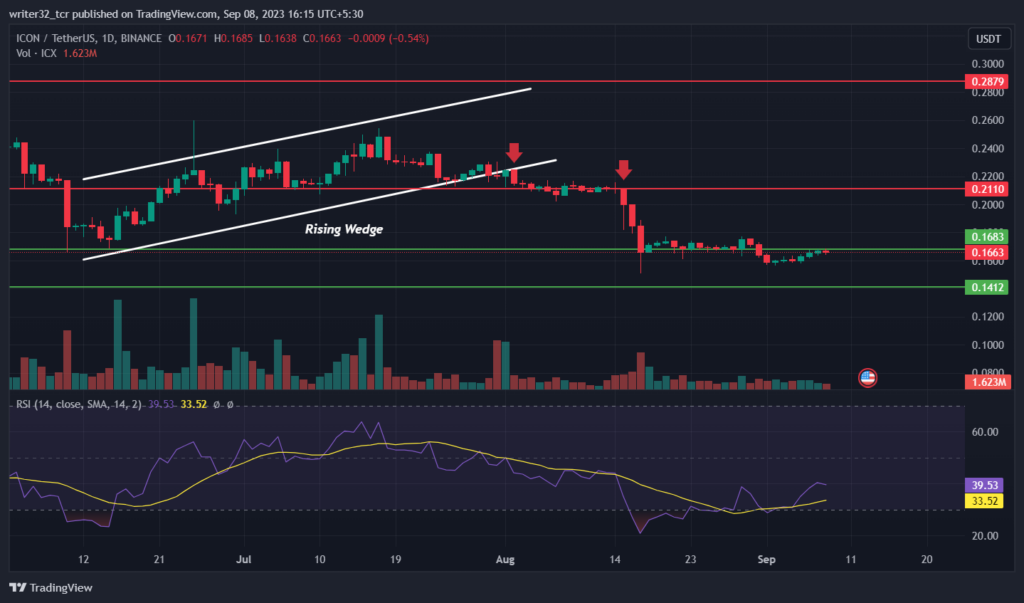
As we can see in the chart, the price made a rising wedge pattern in the daily time frame. After the announcement about the xCall Public Incentivized Testnet Program, the token price started falling and broke down below the rising wedge.
The token price after breaking the wedge also broke the $0.21 support from where possibly the bearish investors entered the market and took the price in a bearish trend. The $0.21 support is now acting as a resistance. Currently, the price is trading just below the $0.168 support.
This support of $0.168 can also act as a resistance. If the coin price gets rejected from that zone, it can fall to the level of $0.14. After falling to $0.14, it can get support from that level because it is an accumulation zone from where the bulls will enter the market.
Suppose the price moves upside with a sizable amount of volume, we can set our targets to $0.21 which is a resistance. The next target will be $0.28.
The RSI is below the neutral level of 50 and the RSI is currently moving at 39.53 points.
The SMA 14 is moving at 33.52 points. ICX coin’s RSI is showing the price under the oversold region, which indicates a bearish trend. The RSI is rejected from the same level where it was rejected before, which shows a negative signal for the price.
Conclusion
After the overall analysis of the token, we can say that we should wait for some days so we can see where the price is giving a weekly closing. If the token price closes above the support of $0.168, it will be bullish. If not, the token price can fall to $0.14. and If we close weekly above the support then we can set our targets to $0.21 easily.
TECHNICAL LEVELS :
- SUPPORT: $0.168 and $0.14
- RESISTANCE: 0.21 and $0.28
Disclaimer
The views and opinions stated by the author, or any people named in this article, are for informational purposes only and do not establish financial, investment, or other advice. Investing in or trading crypto assets comes with a risk of financial loss.