

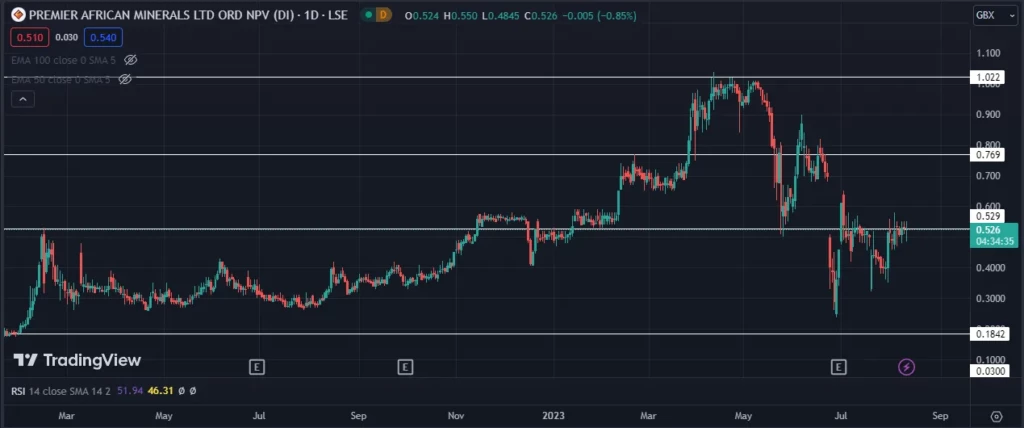
- The stock formed a high of £1.020 in May this year and saw profit bookings from that level.
- The stock in July fell to its yearly low levels, but it has seen good buying since then.
- The stock currently looks stable and slow upside movement can be expected in the months to come.
Premier African Minerals engages in acquiring, exploring, discovering, and defining natural resources. A majority of the company’s work is metal extraction and this has been the main source of revenue since the company was started back in 2007. Financials for the company look weak as the company has seen negative net income in the past two financial years. The next earnings report will be released on 29th September and after that, good movement can be expected towards either side.
Technical Analysis For the Premier African Minerals Stock
The stock has seen stable and good growth since the past year and it created a new high at £1.02, but it could not sustain that level for very long. Sellers entered the stock at that point and since it created a high, it is natural to see buyers exiting and booking their profits due to which the stock slumped down almost back to its previous year’s levels at £0.24. However, the stock was backed by buyers who entered in good volumes, thereby raising the price to the current levels at 0.532£.
The next major resistance is at £0.76 and if a lot of volume is bought at the current levels, then investors can enter with £0.76 as their target.
Chances for the stock to go down are low since buyers are active in good numbers. However, if the price does go down somehow, £0.40 might act as a soft support for the price.
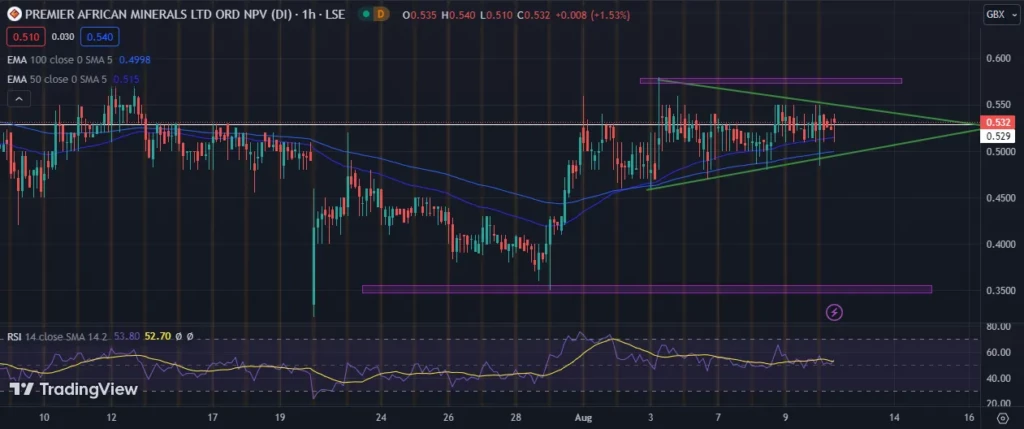
The hourly chart has an interesting triangle in the making for which a breakout can be expected very soon. The stock has been respecting the lower trendline and the upside looks strong too. We can possibly see a breakout from this pattern and if that does happen, one should enter as the price crosses the soft resistance at £0.57.
If we see this breakout happening, the target price would be £0.61.
If there is a downward movement from the current level, £0.48 looks like very strong support.
A close eye must be kept on the stock for the upcoming week as a good movement is expected very soon.
RSI stays neutral while the 50 and 100 EMA predict a possible upward move in the stock.
Conclusion
The stock currently looks strong and stable and it is also forming a pattern from which a breakout is expected very soon. A close eye must be kept on the stock to capture any movement that occurs. A good upward move can be expected in the coming months, but we must also wait for the earnings report that will be out in September.
Major technical levels
- Major support zones: .47£ followed by .42£
- Major resistance zones: .57£ followed by .65£.