

LEO is trading in a tight-range-bound market. The price is trapped between $3.884 and $3.330 from the beginning of the year. This is frustrating the investors as the market is not being able to choose any particular direction.
- LEO/USD is up 1% as of today’s trading session
- LEO/USD is trapped in a range-bound market
LEO/USDT is trading at $3.5703. The price has been in a consolidated market since the start of this year. The price action displays a sideways market condition where the price is trading in a very small range. This consolidation came when the market saw a fall last year. The prices plunged almost 56.93% from its all-time high of $8.40.
The Daily chart shows a consolidated market
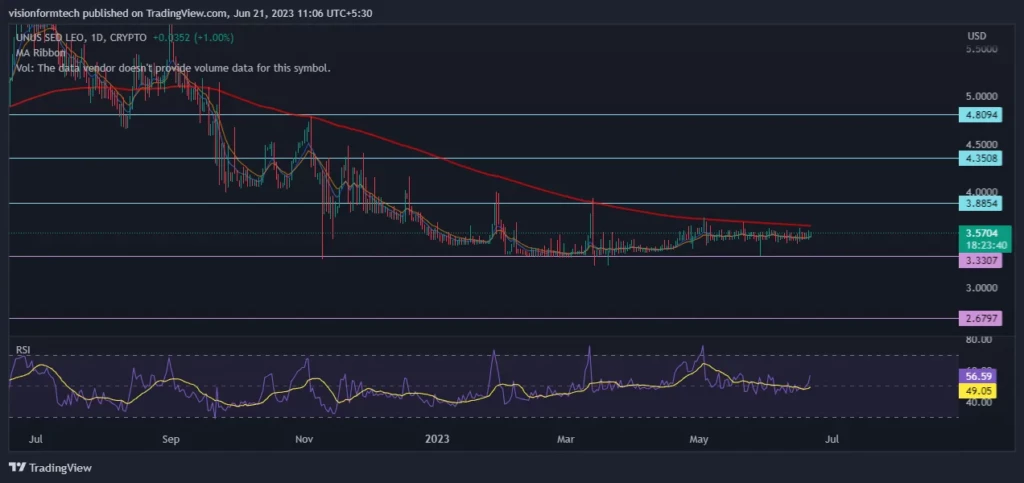
The Daily chart shows that the market is trading in a sideways condition. This choppy movement is keeping the investors away as the trend isn’t changing. According to the technical indicators, the price is trading below the 200 EMA. This indicates that the bears still have the upper hand. Back in March, the market tested the lower level of this range at $3.330. The bulls gradually bought the dip and sent the market back into the range.
The price of $3.330 is a key demand zone. If the bulls fail to defend this level, the price can slide by almost 20%. Pressure is getting built as the market moves in this tight range. On the upside, the bulls have to take over the 200 EMA and can look forward to breaking $3.884. Such a feat can reward the market by at least 12%.
The 4H chart shows a choppy market structure
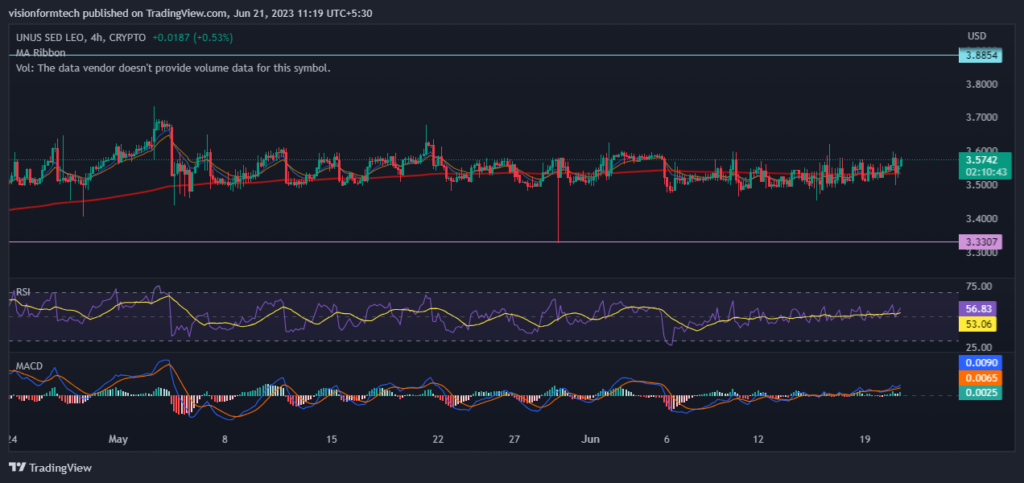
In a shorter time frame, The 4H chart is exhibiting the properties of a zigzag market structure. Such a market may not impress positional investors but can be a treat to scalpers and intraday traders. Due to its fixed range, the market players can easily trade between support and resistance and capture big profits.
Price is crawling around the 200 EMA which may confuse amateur investors. Please make a note that when the price consolidates for a very long, the market can break out of its range with a big momentum just like releasing a compressed spring. Investors are closely watching the demand and supply zones for any breakout which is imminent in the near future.
RSI
The RSI indicator is currently at 56.76, and the RSI has crossed the MA line towards the upside. This is a sign of a bullish to sideways market condition.
MACD
The MACD indicator is moving along the signal line and shows no signs of momentum. This is a sign of a sideways market
200 EMA
The price is moving around the 200 EMA (exponential moving average). This represents a sideways condition, and the direction of the trend is unclear
Technical levels
Support Levels: $3.330 – Support 1
$2.679 – Support 2
Current Price: $3.570
Resistance Levels: $3.885 – Resistance 1
$4.350 – Resistance 2
Conclusion
LEO has become a playground for scalpers and intraday traders. This range-bound market is an ideal condition for high-risk traders as the support and resistance can be spotted easily. Due to this one can sell at resistance and buy at support while maintaining a strict stop loss and consistent profits. Although the investors are waiting for the market to choose a direction so that they can make a sound decision of holding or leaving the position. A key takeaway is that a big breakout is imminent and one must turn on alerts for the above levels.