

- Wishbone Gold is an AIM-listed company in the precious metals market.
- This firm was established = in 2009. The company is listed on the London Stock Exchange.
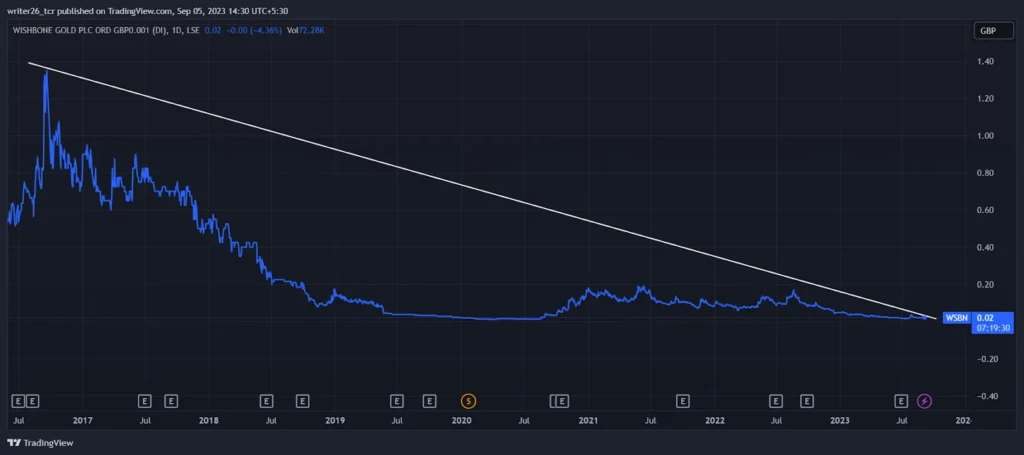
- We will examine the stock price of WSBN.
WSBN stock has been in a downtrend since the year it got listed on the stock exchange. The stock is down by (99.22%) in all time which is very disappointing for any stock.
The stock was down by (89.05%) in the past five years. The numbers are negative in monthly, yearly, and long-term time frames.
Only through the technical analysis, we can say whether the stock is good for investment or not.
Technical Analysis of WSBN (Yearly)
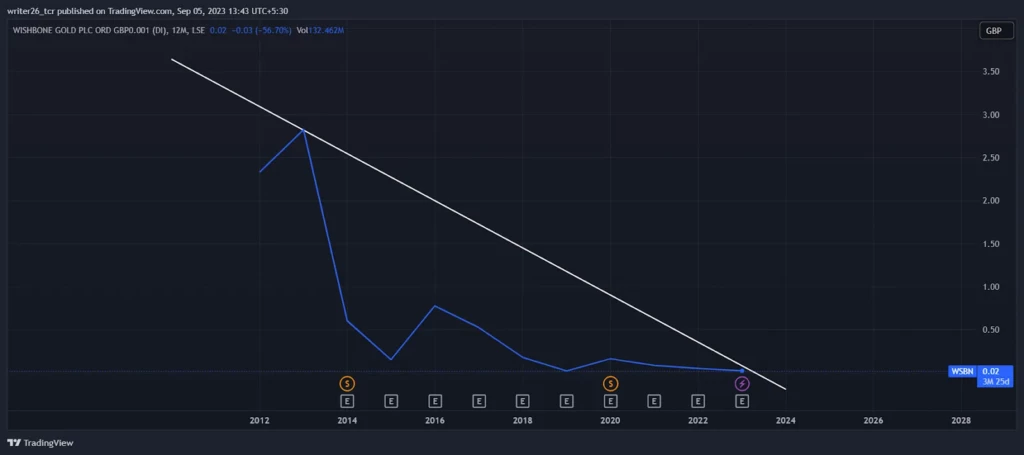
The stock is in a downtrend in the yearly time frame. Since it got listed, the stock never went in the upward direction. It only went in the downward direction.
It may continue the downtrend movement as it never showed any sign of recovery from 2016. It has been in a sideways position near the current market price.
The stock was down by (80.67%) in the last year. It is highly risky for long-term investment.
The stock can touch the zero price but its price value cannot become negative. WSBN was not suitable for the investment from the beginning. It has been falling since 2013. The red candles are the proof of its downfall. There are many stocks available in the market for investment or trading. WSBN and other such stocks are hazardous from the investment point of view.
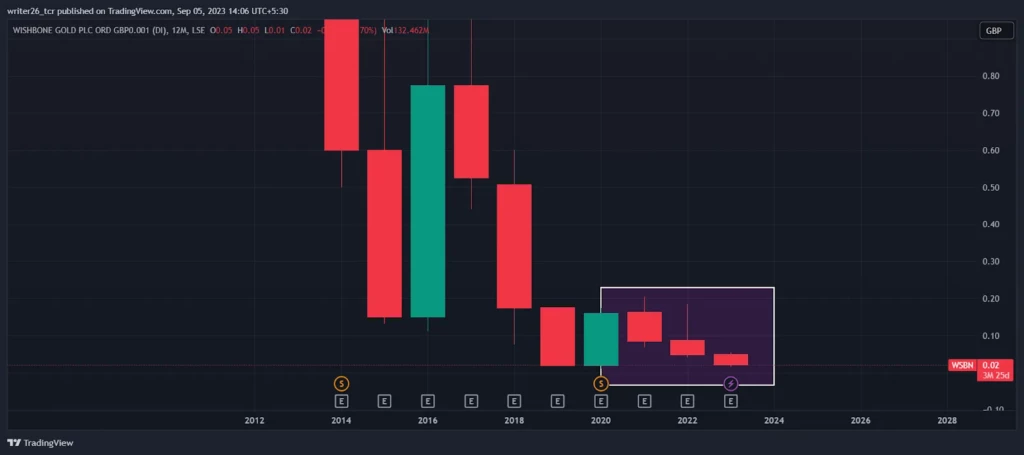
Technical Analysis of WSBN (Monthly)
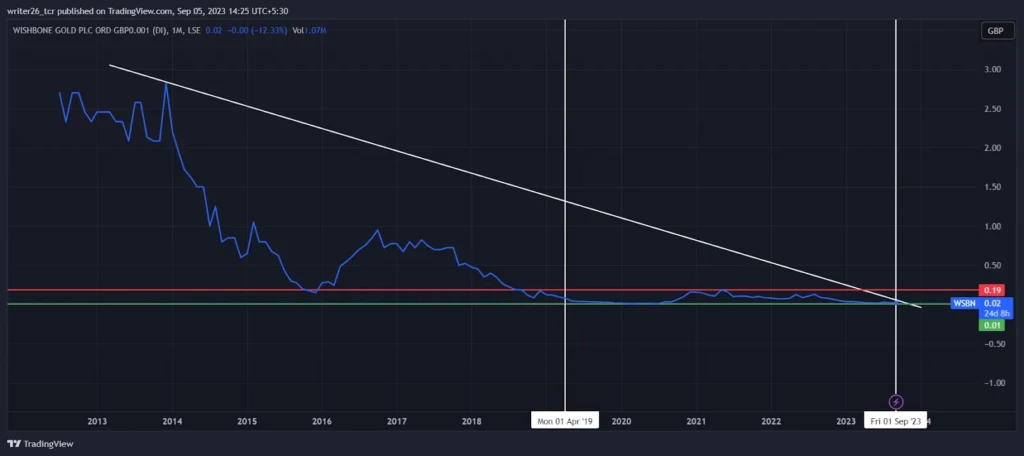
The stock near the current market price is in a sideways position. The stock has been ranging between the support level and the resistance level since April 2019. The stock was down by (2.13%) during the last month. The recovery in this WSBN stock value seems impossible. It may touch the zero level in the upcoming trading sessions.
Investors should think carefully before making any investment decision in this type of stock.
Technical Analysis of WSBN (Weekly)
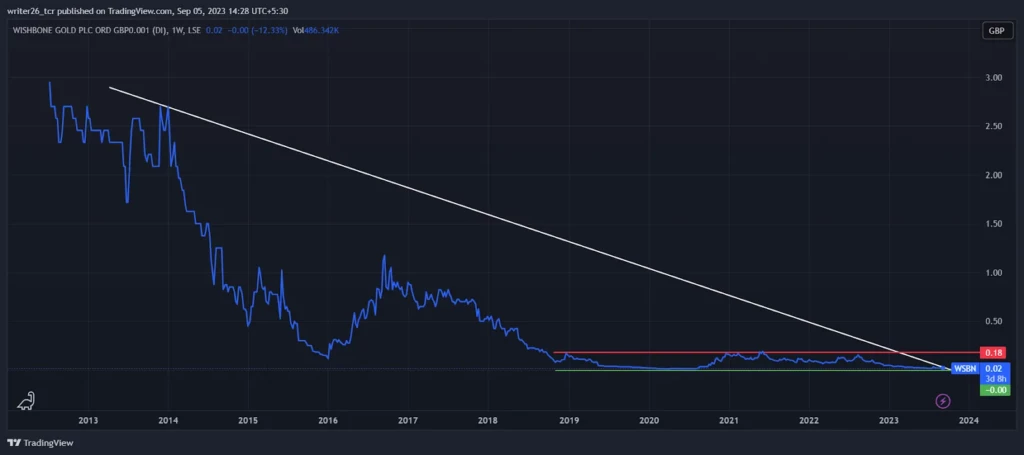
The stock price is up by 21.05% in the past 5 trading days, which is not that appealing. It only showed us some positive numbers in the weekly time frame as compared to other time frames.
According to the analysis, the WSBN stock comes under the category of penny stocks. In such shares the chances of the upper circuit or lower circuit getting hit are high. Investors often wait for days to sell or square off their trade due to the lack of buyers or due to the circuits getting hit.
Technical Analysis of WSBN (Daily)
In the daily time frame, the stock was up by 4.55% during the last trading session. The percentage change can be big but in terms of price, it went up by only 0.10 GBP.
Summary
The downtrend of the WSBN stock continues. In the monthly time frame, it was in the range that can lead to some small returns. The stock might not give a huge return.
So, this stock does not have the potential to deliver immense returns. If it breaks the range in the monthly time frame, it is good for medium-term investment.
Technical Level
- Resistance Level1: GBP- 0.19 and GBP- 0.09
- Support Level: GBP- 0.01 and GBP- 0.04
Disclaimer
The analysis is done for providing information through technical analysis and no investment suggestions are given in the article to be made by investors.