

- FETCH.AI Price Prediction highlights A minor downtrend of $FET since February
- $FET Coin fetched a Year-To-Date Return of 150%.
FETCH.AI Price Prediction represents the correction phase of FET Token which began in February after a new all-time high. FET Crypto is trading at $0.2300. The Market is up 5.45% in the last 24H. The 24H Volume witnessed a fall of 21.24%. The overall market cap of $FET Token is $189,014,669.
PEAQ Network, A Layer1 Blockchain for DePINs (Decentralized Physical Infrastructure Networks) has announced a multi-chain self-powered Machine identities that will be using FETCH.AI Agents to transmit data between Polkadot and Cosmos Ecosystems. This will allow enormous robots and vehicles on DePINs, to connect with systems across Polkadot And Cosmos Ecosystem.
FETCH.AI Price Prediction: A falling wedge may start a bullish reversal.

Source: FET/USDT by TradingView: https://www.tradingview.com/x/g4GSDYkP/
The Daily chart represents the bearish price action of FET Crypto where the prices decline while making lower lows. Fetch.ai had a great start to the year where the prices rallied more than 500% to make a new all-time high at $0.611. Market did get a bounce of almost 40% after taking support at $0.1741
FETCH.AI Price Prediction highlights the correction phase of the FET Crypto. The market has made a correction of almost 61%. Meanwhile, the price is forming a big falling wedge pattern wedge which has a potential of at least 160% to the upside and the market is getting close to the breakout
Volatility may be around the corner : Technical Indicators
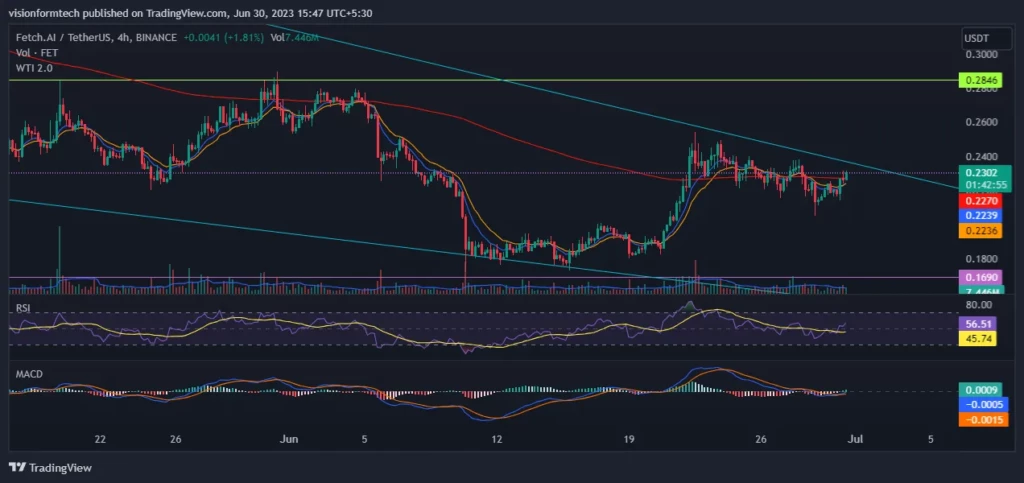
According to the 4h Chart, the prices are inching towards the trendline of the falling wedge. Bulls are eagerly pushing the prices to break the resistance that will trigger buying pressure. This may kickstart a bullish rally where the prices will have overcome the resistance level of $0.286.
The technical indicators are showing increasing momentum as the values rise gradually. Investors should wait for a volume supported breakout and a retest to enter into an ideal position. If the prices fail to breakout, expect a fall of at least 26% where the prices will test the primary support level.
RSI:
The RSI indicator is currently at 55.71 on the 4H. It means the market can be sideways
MACD:
The MACD has made a bullish crossover. The Indicator is planning to move above 0. The market may witness bullish action in the short-term
200 EMA:
As observed, on the 4hr, the price is trading near the 200 EMA(exponential moving average) . It is important to let the prices move away from the indicator to get a clear understanding of the trend.
Conclusion:
FETCH.AI Price Prediction represents the correction phase of FET Token which began in February after a new all-time high. Overall trend is moderately bearish because the prices are below 200 EMA. The Falling wedge may be the gateway for the bulls to kickstart a new rally. A powerful breakout is necessary for the recovery of the price. Investors are advised to remain calm and wait for the opportune moment to make the investment decisions
Technical levels
Support Levels: $0.1728- Support 1
$0.1243- Support 2
Current Price: $0.2300
Resistance Levels: $0.2846 – Resistance 1
$0.3313 – Resistance 2
Disclaimer:
The views and opinions stated by the author, or any people named in this article, are for informational purposes only and do not establish financial, investment, or other advice. Investing in or trading crypto assets comes with a risk of financial loss.