

Horizen has been deteriorating since February of this year. The asset is constantly losing value after the bulls failed to breach the above level at $15.57. This has caused the price to fade by almost 58.38% leaving the investors worried.
- ZEN/USDT is up 2.27% today
- ZEN/USDT has formed a declining resistance which can be represented by a trendline
ZEN/USDT is trading at $6.41 which is a 15.30% recovery from its recent dip at $5.49. The recent fall almost made it to an all-time low at $5.04. The price bounced quickly indicating the presence of bulls at this important demand zone. The overall market structure represents a very bearish price action where the bulls are getting rekt on a frequent basis.
The Daily chart shows the formation of a falling wedge
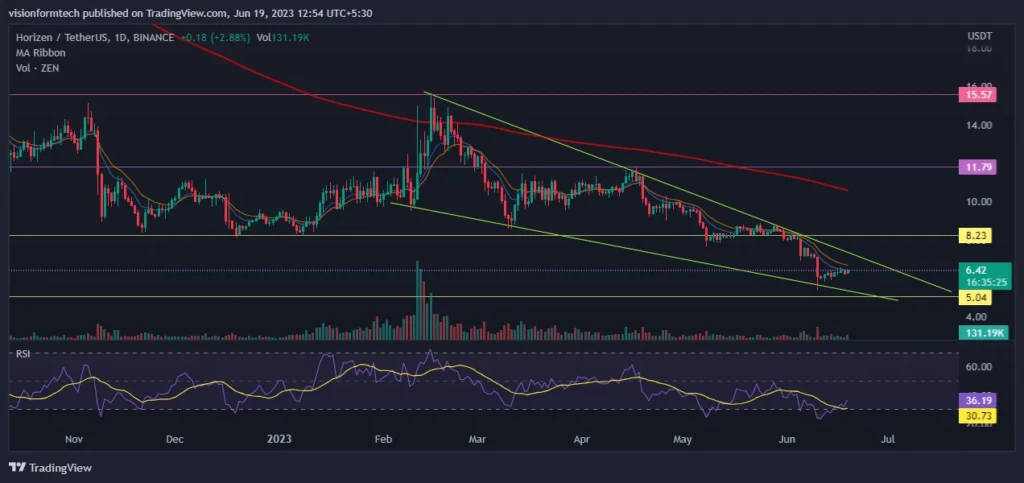
The daily chart showcases a selling frenzy across the market. It can be traced back to the beginning of February when the price got rejected from $15.52. This is a very strong resistance where the bears are stopping the bulls from moving upwards. The sell-off got intense when bulls lost a major support level of $8.23. This led to a fall of almost 33.40%.
The price reached just inches away from its all-time low. This created a sense of extreme fear in the market. Meanwhile, some investors are looking at this situation as a potential market entry point. This is due to a low risk-to-reward ratio. The price is also forming a falling wedge pattern and this could help the bulls to change the market sentiments in the short term. A break out of this pattern has an upside potential of almost 115%. This can make the buyers greedy, and the market can experience aggressive buying.
The 4H chart shows a potential bear flag
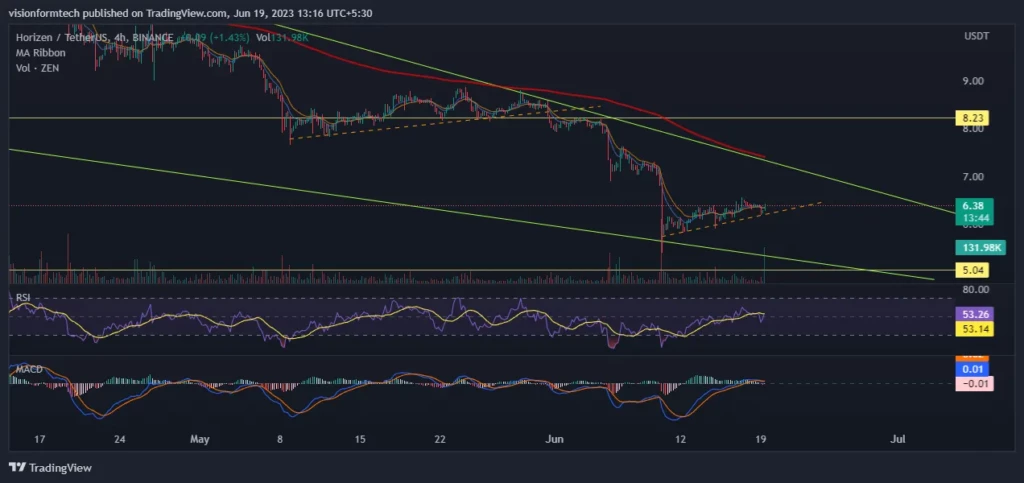
On the 4H Chart, the price appears to be consolidating towards the upside. This type of price action is observed in a downtrend, and it can potentially form a bear flag. The formation and the breakdown of a bear flag can be observed just before its recent downfall. This increases the probability of the repetition of such price action. In such a case, the price is expected to take rejection from the 200 EMA which is aligning with the trend line.
If this happens, the price will tumble down below the all-time low, and this will cause a panic selling where the market can witness a massive sell-off. The only hope for the bulls is now the upper trendline of the descending channel. A break above it will represent a change of character, and the market might start a new journey towards the upside. This flight toward the upside will face its first turbulence at the resistance level of $8.23
RSI
The RSI indicator is currently at 53.4, and the RSI has crossed the MA line towards the upside. This is a sign of a bullish to sideways market condition.
MACD
The MACD indicator made a bullish crossover. It is barely crossed above the 0 lines, but the histogram is representing a low momentum. This means the market is missing strength.
200 EMA
As observed, on the 4hr, the price is trading below the 200 EMA(exponential moving average) which acts as a significant resistance. This is a clear indication of a downtrend where the sellers are in control and for a trend reversal, the price must break and trade above the 200 EMA.
Technical levels
Support Levels: $5.70- Support 1
$5.04 – Support 2
Current Price: $6.41
Resistance Levels: $8.23 – Resistance 1
$11.79 – Resistance 2
Conclusion
ZEN is feeling the pressure created by the bears due to continuous selling. This sell-off is annoying the investors and the market sentiment represents extreme fear. A small ray of hope comes in the form of a trendline which can become the key point for reversal. Investors must closely watch this trendline and wait for a bullish candle to close above it on the Daily chart. Such an event can spark the confidence of the bulls, and the price can shoot up to $15. Until then the market is a risk of further downfall.